
Pivotal Events: Tariffs Saga, Landmark Legislation and Corporate Earnings
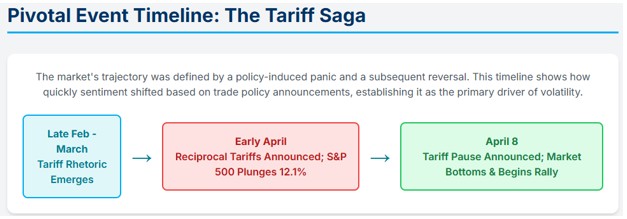
The Tariff Saga: In early April, sweeping 'reciprocal tariffs' caused a policy-induced panic, with the S&P 500 dropping 12.1% in just four trading sessions and the VIX peaking over 52, disrupting global logistics and mergers and acquisitions. The market rebounded robustly on April 8th after the Trump administration “paused” severe tariffs, highlighting the market's hyper-sensitivity to trade policy.
Landmark Legislation: “One Big Beautiful Bill Act” Passed on July 3rd and signed into law on July 4th, this 870-page budget reconciliation package played a crucial role in the market's resilience, acting as a powerful 'fiscal put' under the market. The passage of the bill was ‘baked into the cake’ and its failure would have spelled disaster for the markets.
Corporate Activity: M&A and Earnings
Mergers & Acquisitions (M&A): While global deal volumes declined by 9%, values paradoxically rose by 15%. This phenomenon was attributed to a flight to quality and a 19% increase in megadeals worth over $1 billion.
Earnings: Q1 2025 S&P 500 earnings growth was strong at 12.8%. However, the quality of these results was questionable, with revenue beats falling below the median. A record-high 38% of S&P 500 companies issued negative earnings per share (EPS) guidance for Q2, frequently citing tariff uncertainty.
Market Performance: A V-Shaped Recovery
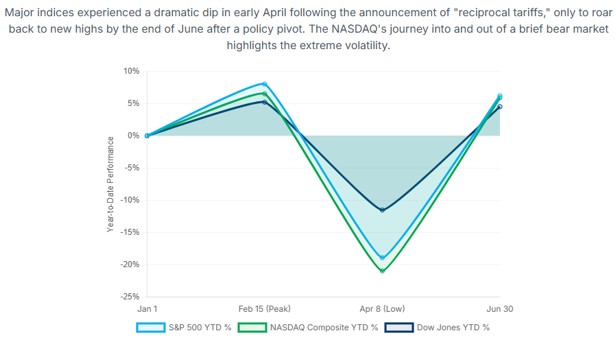
U.S. equity markets experienced significant volatility, undergoing a V-shaped recovery in the first half of 2025. After an intense intra-period volatility, the S&P 500 plummeted nearly 19% from its February peak to an early April low. However, it then staged a remarkable rebound, surging nearly 24% from its April 8th bottom to reach new all-time highs by June. This rapid ascent marked the fastest-ever surge into record territory for the S&P 500 following a decline of at least 15%, primarily attributed to the immense power of policy shifts.
First Half (H1) Total Return – Index Performance
- S&P 500: +6.2%
- NASDAQ Composite: +5.5% (following a dramatic drawdown of nearly -21% in early April)
- Dow Jones Industrial Average: +3.6%
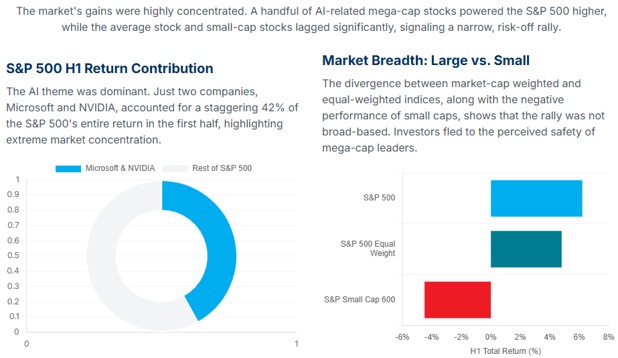
- S&P 500 Equal Weight Index: +4.8% (significantly underperforming the market-cap weighted S&P 500, indicating narrow market breadth)
- S&P Small Cap 600 Index: -4.5% (highlighting investors' flight to quality)
The Concentration Conundrum
Despite the overall market gains, the rally was remarkably narrow. A significant portion of the S&P 500's entire H1 2025 total return was driven by just two companies, Microsoft and NVIDIA, which accounted for a staggering 42%. Furthermore, a select group of nine AI-beneficiary stocks contributed the vast majority of the index's gains.
Conversely, other major companies like Tesla, Apple, and UnitedHealth Group were significant detractors. This high level of concentration in market performance presents a unique form of systemic risk.
H1 Macroeconomic Overview: Navigating Contraction, Moderating Inflation, and a Dovish Fed
The U.S. economy experienced a contraction in Q1 2025, with real GDP declining at an annualized rate of -0.5%. However, a more accurate indicator of underlying demand, real final sales to private domestic purchasers, showed resilience with a 1.9% increase.
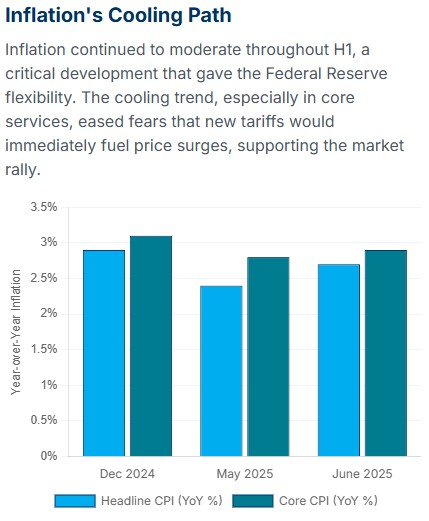
Inflation continued its downward trend, a crucial factor supporting the market rally. Headline CPI cooled to 2.7% year-over-year by June 2025 (from 2.9% in December 2024), and Core CPI rose by only 2.8% year-over-year. This moderation occurred as businesses absorbed initial cost increases from tariffs.
The Federal Reserve maintained a patient approach throughout H1, keeping the federal funds rate steady at 4.25% to 4.50%. The “dot plot” indicated a dovish stance, projecting two more quarter-percentage-point rate cuts before the end of 2025, reinforcing market expectations for easing.
The labor market showed signs of cooling, with a modest increase of 147,000 in non-farm payroll employment in June. The unemployment rate remained at 4.1%, and wage growth was maintained at 3.7% year-over-year. The “Great Resignation” transformed into a “Great Reshuffle,” with 48% of workers considering new employment opportunities.
Sector Performance and Commodity Highlights
The market has seen a clear divergence in sector performance, with some sectors significantly outperforming while others lag. Commodities, particularly precious metals, have also experienced notable gains.
Outperforming Sectors:
- Financials (+19.6%): This sector emerged as the top performer, driven by a widening yield curve (10-year minus 2-year Treasury spread at 0.56) and increased capital markets activity, including a strong resurgence in SPAC issuance.
- Industrials (+12.7%): Confidence in the domestic economy and a surge in defense spending contributed to this sector's robust growth.
- Communication Services (+11.1%): Large-cap companies like Meta Platforms and the growing influence of artificial intelligence (AI) were key drivers.
- Information Technology (+8.1%): The AI theme, particularly benefiting companies like NVIDIA and Microsoft, was almost solely responsible for this sector's performance, masking underlying weaknesses elsewhere.
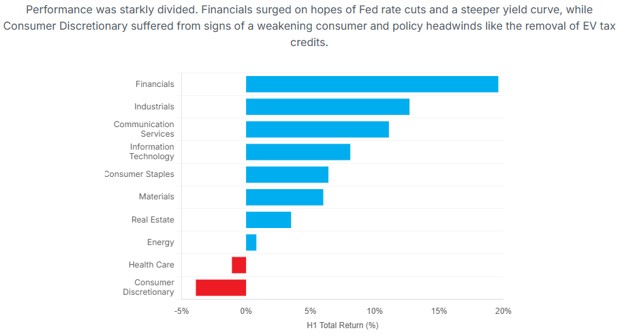
Lagging Sectors:
- Consumer Discretionary (-3.9%): This was the weakest sector, impacted by signs of declining consumer spending and a significant downward revision in earnings expectations (a projected 5.1% drop in Q2 earnings). The One Big Beautiful Bill Act, which eliminated EV tax credits, notably affected Tesla within this sector.
- Health Care (-1.1%): This sector underperformed due to weak fundamentals and downward pressure on earnings estimates, especially in speculative sub-sectors like biotechnology.
Commodities Spotlight:
Precious metals demonstrated exceptional gains:
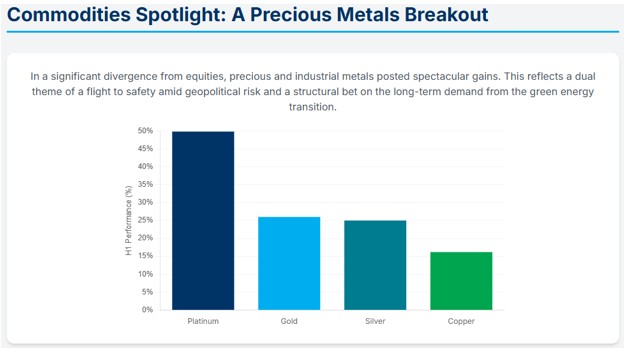
- Platinum (+49.8%): Its rise was attributed to industrial demand, its use in diesel catalytic converters, and its role in the green hydrogen economy.
- Gold (+26%) and Silver (+25%): These metals benefited from safe-haven demand and the anticipation of Federal Reserve rate cuts.
- Copper (+16.2%): Demand from AI data centers and the ongoing energy transition fueled its increase.
The Bottom Line
The market's extreme concentration in a few AI-leveraged mega-cap tech stocks poses a significant systemic risk, making the overall index highly susceptible to negative catalysts affecting these companies. Additionally, classic late-cycle signals, such as the outperformance of Financials and underperformance of Consumer Discretionary, suggest the market is anticipating a substantial economic slowdown and positioning for lower interest rates.
H1 AI Update


Spencer Wright is the Executive Vice President of Halbert Wealth Management, Inc. and the author of Forecasts & Trends. He has been with HWM for over 25 years.