

Today we will look at the market’s historically weakest month since 1928. September has been a challenging month for the stock market, consistently showing negative average returns for major indices like the S&P 500 and the DJIA.
September’s Statistics
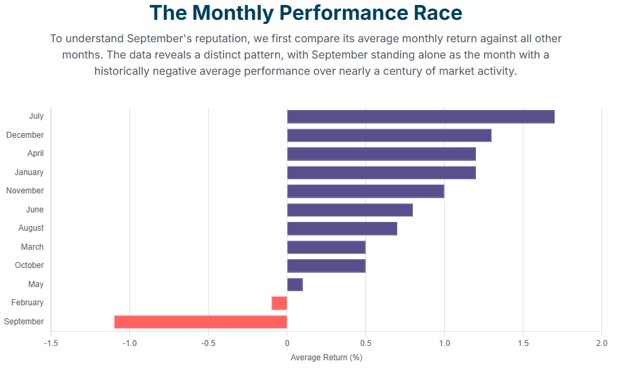
- Negative Average Returns:
- S&P 500: Average September returns range from -1.1% to -1.2% since 1928.
- DJIA: Average September declines are approximately -1.0% to -1.1%.
- This performance gap highlights September's unique historical weakness.
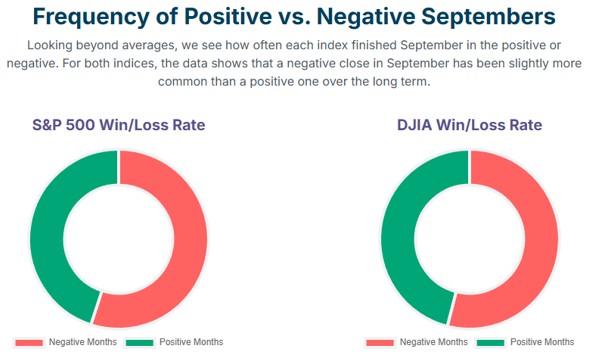
- Lowest “Win Rate” (Frequency of Positive Returns):
- September is the only month where negative returns occur more often than positive ones.
- S&P 500: September’s “win rate” since 1928 is only 45%, significantly lower than the 61% for other months.
- DJIA: September's “win rate” is even lower at 42.2% (since 1897).
- This makes September the sole month when the S&P 500 has declined more frequently than it has risen.
- Magnitude of Losses:
- When the market declines in September, the losses tend to be substantial.
- The S&P 500 typically falls about -4.7% in a negative September, similar to the biggest average declines seen in May and October.
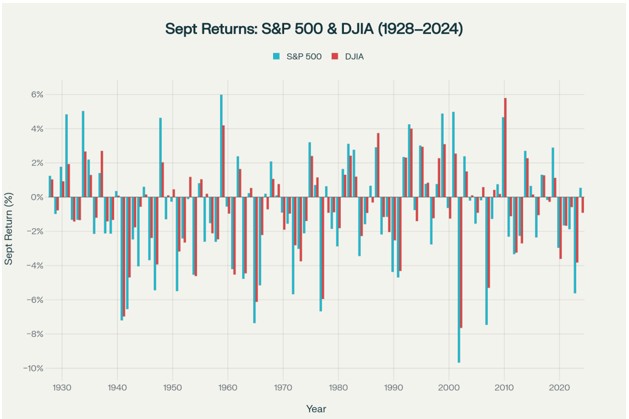
Role of Outlier Events and Tail Risk
September has historically been a challenging month for the S&P 500, accounting for a disproportionate share of major market declines. Of the 40 worst monthly losses for the S&P 500 since 1928, nine occurred in September, more than any other month.
Key historical examples of significant September declines include:
- September 1931 (Great Depression): A catastrophic −29.6% drop in the S&P 500's precursor index, marking the most severe monthly decline on record.
- September 2001 (Post-9/11): The S&P 500 plunged 11.6% in the week following the terrorist attacks.
- September 2002 (Dot-Com Aftermath): The S&P 500 lost approximately 11% and the DJIA about 12%, making it the worst September since the Great Depression.
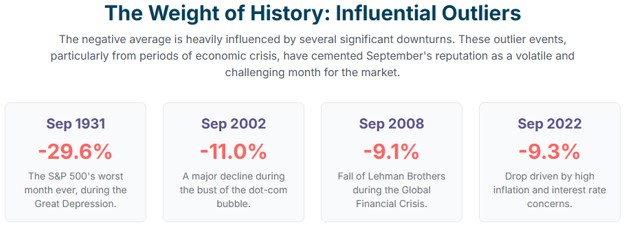
- September 2008 (Global Financial Crisis): This month saw the Lehman Brothers bankruptcy, the AIG bailout, and a record single-day DJIA plummet of 777.68 points (7.1%) after the initial rejection of the bank bailout plan.
- September 2022: A more recent example saw a −9.3% drop amidst aggressive Federal Reserve interest rate hikes.
While extreme events heavily influence the long-term average, the high frequency of negative returns (55% of all Septembers) suggests a persistent underlying weakness. These outlier events exacerbate an already existing statistical weakness rather than being the sole cause.
The Enduring “September Effect” in Market Performance
The “September Effect,” a historical pattern of market underperformance during September, is not a fleeting anomaly but a consistent feature across various historical periods.
- Persistent Across Eras: Analysis of S&P 500 data from 1920 to 2024 reveals that September is one of only two months to show negative cumulative returns in both 52-year halves of this period (1920–1971 and 1972–2024). Over 105 years, September's cumulative return was a significant −73.9%.
- Strength in the 21st Century: Contrary to expectations that market anomalies diminish over time, the September Effect has remained strong, and potentially even strengthened, in the 21st century.
- Four of the five Septembers prior to 2024 saw the S&P 500 decline by an average of −4.2%, substantially worse than the long-term average decline of −1.2%.
- The 2020s, to date, exhibit the most severe average September decline of any decade, at −4.20%.
- Decadal Variations: While the effect's magnitude can vary by decade, September weakness has been pronounced during periods of significant economic turmoil, such as the 1930s, 1970s, 2000s, and 2020s.
The Bottom Line
The “September Effect” is a statistically valid and persistently observed phenomenon in U.S. equity markets. Based on nearly a century of data from the S&P 500 and the DJIA, September consistently ranks as the worst-performing month, characterized by negative average returns, a higher frequency of losses, and susceptibility to severe market declines. While not a guarantee for any single year, its historical presence across various economic and market conditions reinforces its significance as a data-driven historical probability.
AI September Effect


Spencer Wright is the Executive Vice President of Halbert Wealth Management, Inc. and the author of Forecasts & Trends. He has been with HWM for over 25 years.