
This Week’s Highlights:
- A deep dive into the history of the American tax system.
- An unpacking of who pays the bills (federal revenues).
- Tracking how federal revenues have evolved over time.
- Exploration of the supply-side economic argument: lowering tax rates can spur enough economic growth to pay for themselves.
A Quick Trip Down Tax Memory Lane
For a large portion of our nation’s history, the federal government did not tax individual incomes at all. Instead, it relied almost exclusively on indirect taxes like customs duties (tariffs on imported goods) and excise taxes on specific products to fund its operations.
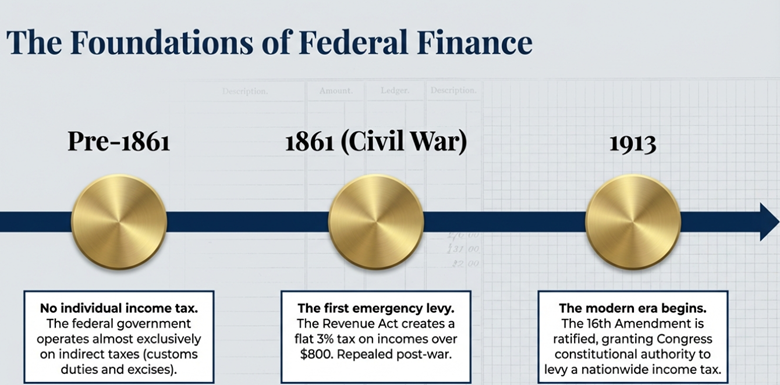
The incredible financial burden of the Civil War forced a temporary change, leading to the Revenue Act of 1861, which created a flat 3% tax on incomes over $800. A year later, this was replaced with a progressive tax, meaning higher earners paid higher rates, though these taxes were eventually repealed after the war.
The modern tax era officially began a century ago with the ratification of the 16th Amendment in 1913, which gave Congress the constitutional authority to levy a nationwide income tax. Initially, this was a class tax that impacted only the wealthiest 3% of the population, featuring a top marginal rate of just 7%.
Global conflicts quickly transformed the tax code. During World War I, the top rate soared to 77% to fund military efforts. By World War II, the government needed massive, steady revenue, transforming the income tax from a narrow levy into a mass tax. The top marginal rate reached an astounding 94% in 1944.
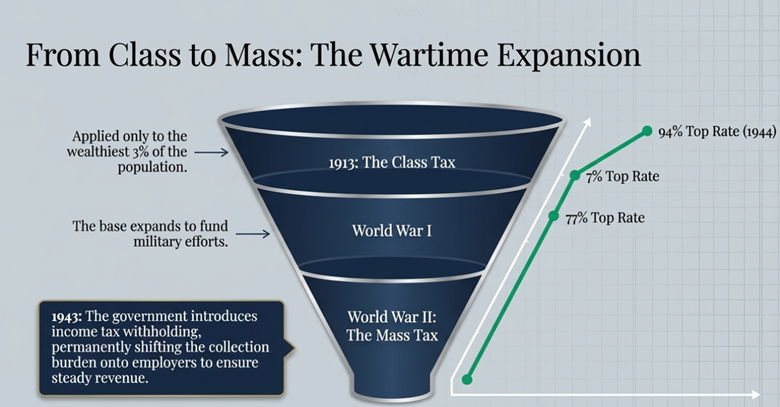
To make collecting these taxes easier, the government also introduced the concept of income tax withholding in 1943, shifting the administrative burden of tax collection directly onto employers.
Who Actually Pays the Tax Bill Today?
When we look at who funds the federal government today, the data reveals a highly progressive income tax system. In 2021, the top 1% of earners paid 45.8% of all federal individual income taxes, despite earning 26.3% of the total adjusted gross income. To put that concentration into perspective, the top 50% of taxpayers paid 97.7% of all federal individual income taxes, while the bottom 50% paid just the remaining 2.3%.
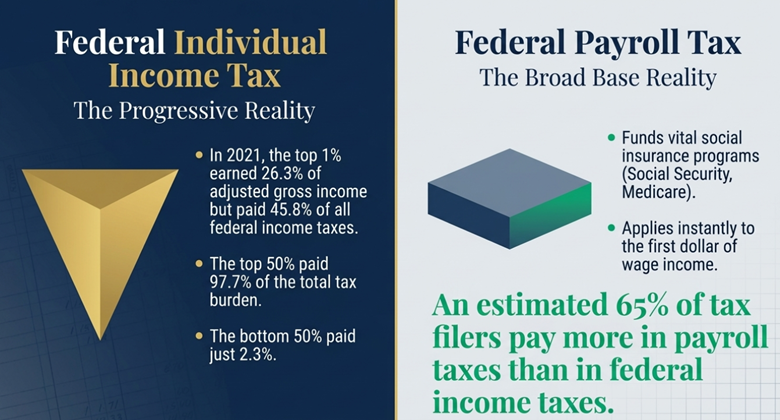
However, looking only at the individual income tax does not tell the full story for the average American worker. Most citizens also pay federal payroll taxes, which fund vital social insurance programs like Social Security and Medicare.
Because these taxes apply to the first dollar of wage income, they represent the primary federal tax liability for the majority of households. In fact, an estimated 65% of tax filers pay more in payroll taxes than they do in federal income taxes.
The Evolution of Federal Revenue
Just as the rates have changed, the primary sources of government revenue have entirely flipped over the last century. Back in 1915, individual income taxes contributed a mere 5.9% of total federal revenue, while customs and excise taxes brought in nearly 90%.
Today, individual income taxes are the absolute bedrock of federal receipts, making up roughly 49% of all revenue, with payroll taxes contributing another 36%. Meanwhile, corporate income taxes have seen their share shrink from nearly 30% in the 1950s to under 10% today.
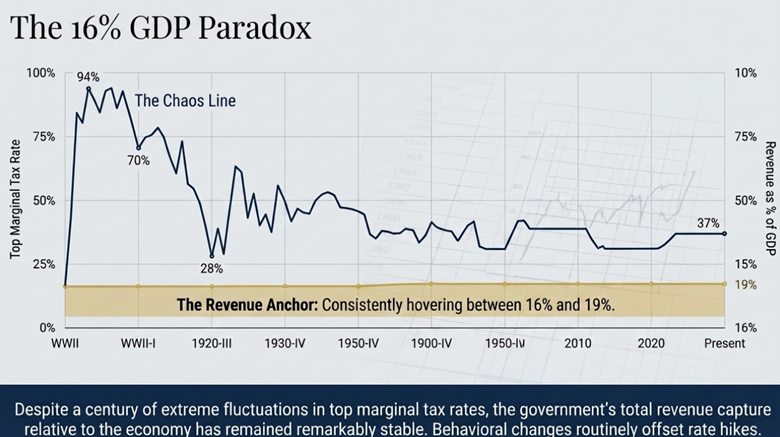
Here is where the data gets incredibly interesting: despite a century of wild fluctuations in top marginal tax rates, bouncing from 7% to 94% and back down to 37% today, the total amount of revenue the federal government collects relative to the size of the economy has remained remarkably stable.
Since the end of World War II, total federal tax revenues have consistently hovered between 16% and 19% of the Gross Domestic Product (GDP). This historical consistency suggests that raising tax rates does not necessarily squeeze more money out of the economy, as behavioral changes often offset the rate hikes.
The Supply-Side Argument: How Tax Cuts Can Pay for Themselves
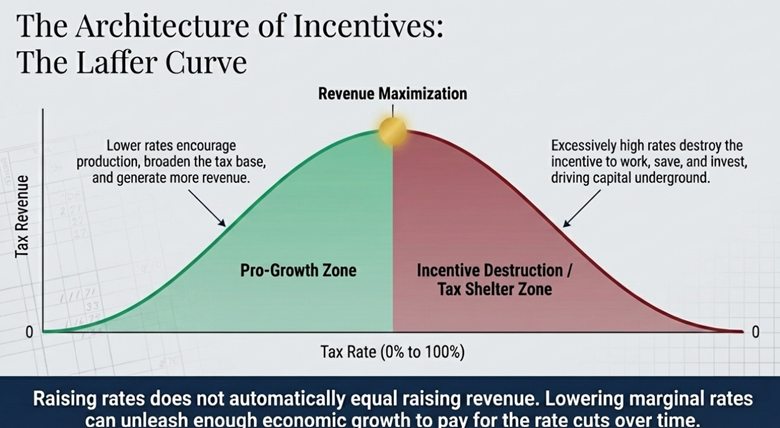
This brings us to a fascinating economic debate: can cutting taxes actually increase government revenue? The supply-side economic argument, often illustrated by the Laffer Curve, suggests that the answer is a resounding yes.
The Laffer Curve is an economic concept showing that if tax rates are excessively high, they destroy the incentive to work, save, and invest. By lowering marginal tax rates, the government removes penalties on production and unleashes economic growth. This growth broadens the overall tax base, generating more revenue at a lower rate.
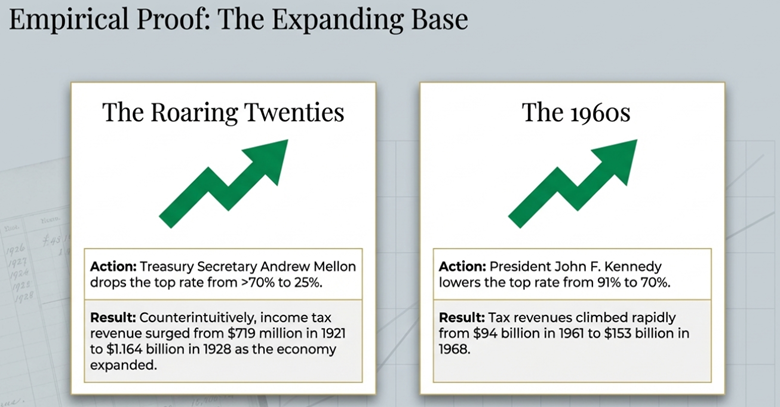
Historical data provides powerful examples of this dynamic in action. During the Roaring Twenties, Treasury Secretary Andrew Mellon championed drastic rate reductions, dropping the top marginal rate from over 70% down to 25%. Counterintuitively, income tax revenue surged from $719 million in 1921 to $1.164 billion in 1928 as the economy expanded.
We saw this again in the 1960s. Following President John F. Kennedy’s tax cuts, which lowered the top rate from 91% to 70%, tax revenues climbed from $94 billion in 1961 to $153 billion in 1968.
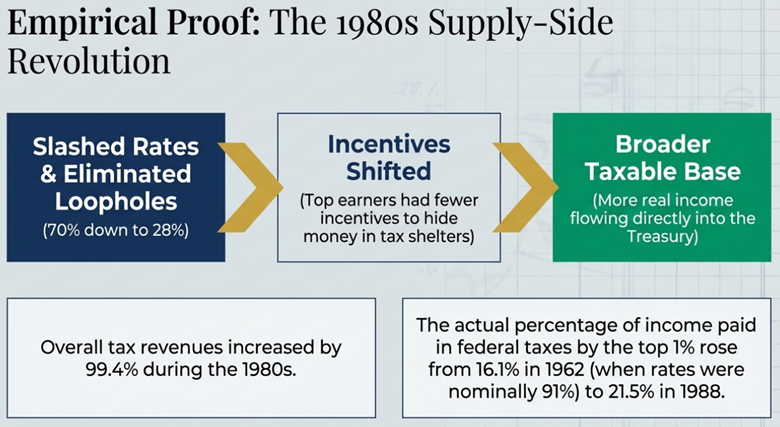
The most famous modern application of this theory occurred during the Reagan supply-side revolution of the 1980s. President Reagan successively slashed the top personal income tax rate from 70% down to 28% while simultaneously eliminating numerous loopholes and exemptions. The results were staggering.
Overall tax revenues increased by 99.4% during the 1980s. Furthermore, the percentage of income that the top 1% of earners actually paid in federal taxes rose from 16.1% in 1962 (when the top rate was nominally 91%) to 21.5% in 1988. By simplifying the code and lowering rates, top earners had fewer incentives to hide their money in tax shelters, resulting in more taxable income flowing into the Treasury.
This pro-growth philosophy applies to corporate taxes as well. When the 2017 Tax Cuts and Jobs Act (TCJA) permanently lowered the corporate tax rate from 35% to 21%, the goal was to lower the cost of capital (the return required to make a business investment worthwhile). A lower cost of capital incentivizes businesses to expand their capital stock, buying new equipment, building new factories, and expanding operations.
A larger capital stock ultimately translates into a larger economy, higher wages, and rising living standards for workers. In the years following the TCJA, individual income tax revenue collected in 2019 was $130 billion higher than in 2017, proving that vibrant economic expansion can offset the static costs of tax cuts. In fact, total actual tax revenues in the post-pandemic recovery have consistently surpassed the baseline forecasts made prior to the tax cuts.
The Bottom Line
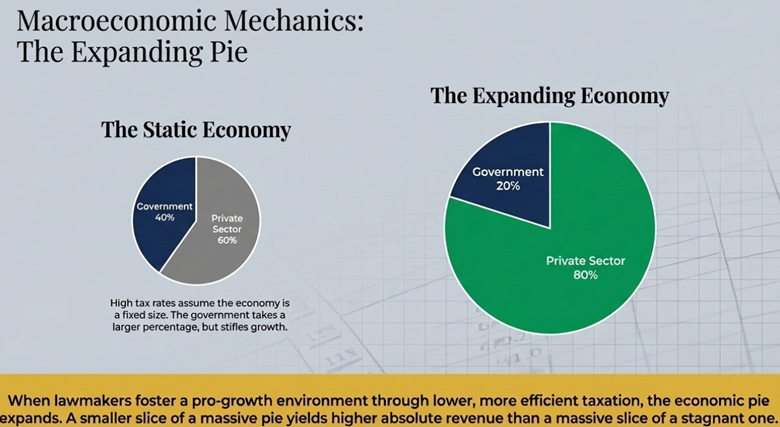
When evaluating fiscal policy, it is crucial to remember that the economy is not a static pie. When lawmakers foster a pro-growth environment through lower, more efficient taxation, the economic pie expands, benefiting businesses, workers, and government revenues alike.
Until next week, stay informed.
The AI Internal Revenue

Spencer Wright is the Executive Vice President of Halbert Wealth Management, Inc. and the author of Forecasts & Trends. He has been with HWM for over 25 years.