

The Atlanta Fed
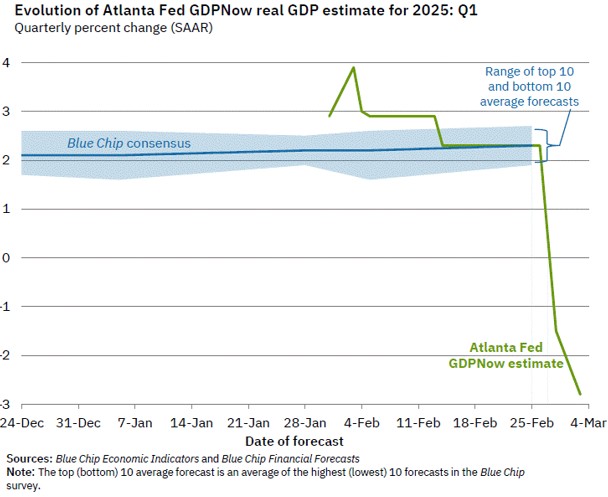
What a difference a few days make. Last Wednesday, the Atlanta Fed was forecasting GDP growth of about 2.3% for the first quarter of 2025 with its GDPNow tool. As of Monday March 3, 2025, that forecast swung to -2.8%. If this is correct, it will be the first quarterly contraction since 2022.
From the Fed, “Latest estimate: -2.8 percent — March 3, 2025
“The GDPNow model estimate for real GDP growth (seasonally adjusted annual rate) in the first quarter of 2025 is -2.8 percent on March 3, down from -1.5 percent on February 28. After this morning’s releases from the US Census Bureau and the Institute for Supply Management, the nowcast of first quarter real personal consumption expenditures growth and real private fixed investment growth fell from 1.3 percent and 3.5 percent, respectively, to 0.0 percent and 0.1 percent.”
This is a big reversal from the previous forecast. The articles over the weekend were numerous and attempted to explain this surprise reversal. The common reasons across 20 articles are:
- GDP growth has slowed from 3.9% to 1.5% in just a month
- Inflation has increased to 2.5% annual growth
- Consumer sentiment has fallen, with expectations for year-ahead inflation rising to 4.3%
- Business investment may be impacted by policy uncertainty (Trump tariffs)
And while the various articles read broadly agree on the root causes of this surprise from the Atlanta Fed, the Federal Reserve System of Banks has other models that are run at various Fed banks, and they do not agree.
The NY & Cleveland Feds
Here is the Nowcast model from the Federal Reserve Bank of New York for the same period as the Atlanta Fed model:
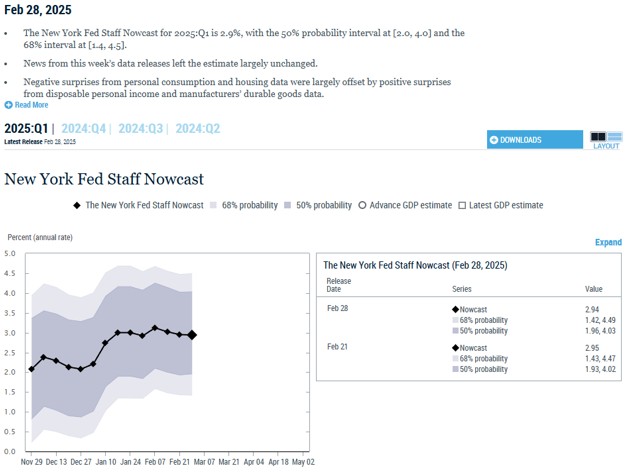
The NY Fed is currently forecasting a rise of 2.9% in GDP for the first quarter with a 50% probability of GDP coming in between 1.96% and 4.03% and a 68% probability of GDP coming In between 1.42% and 4.49% respectively. These are large ranges but none of these forecasts are negative.
To cloud the issue further, the Federal Reserve Bank of Cleveland has a yield curve model they use to forecast GDP growth. Consider their current graph:
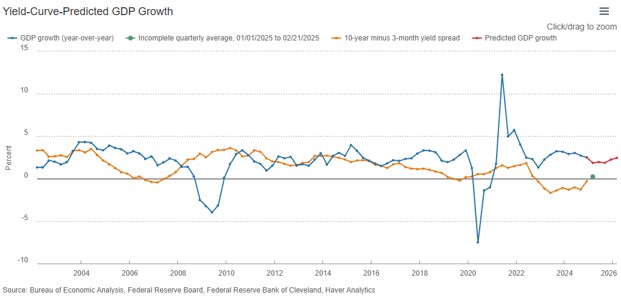
According to their model, GDP is forecasted to grow at 1.86%. They also see continued growth a year out.
So that is two votes for growth and one vote for contraction from within the Fed. If you needed a reminder that the economy is vast and difficult to forecast, this is it. When there are contradictions like this it makes sense to weigh the balance of the evidence.
Even if Atlanta is correct in this scenario, it takes two consecutive quarters of negative growth (despite the Biden Administration’s protestations to the contrary) to equal a recession. And it is important to keep in mind that these are complicated models that by their nature have built-in biases.
What if we could remove the bias of the various models and consider the data? No filters, no transformers, no stochastics, just the raw numbers. The Fed does not do that, but an independent website called the econpi.com does.
Just The Facts
I have used the “econ p.i.” for several years simply because it is not a forecasting model per se. I love the site and I encourage you to spend some time looking through the available data. Looking at this unfiltered data over the last 15 years is fascinating.
Here is the current reading from the econ p.i.:
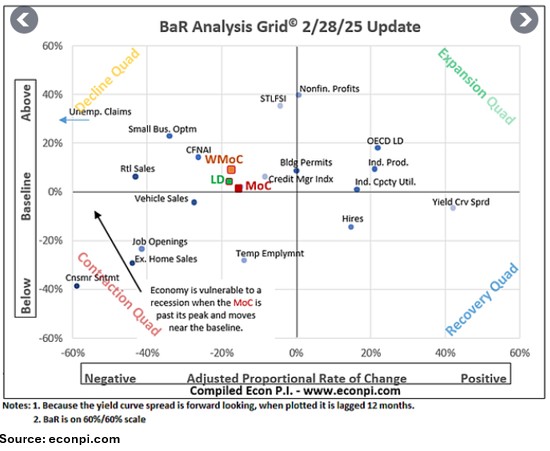
Here is how econpi.com explains the chart above:
“The Baseline and Rate of Change (BaR) Analysis Grid© clarifies current economic conditions and signals how near the economy is to a recession. The mean of coordinates (MoC) indicates the overall health of the economy. Leading indicators (LD) are a subset of indicators that provide insight into emerging trends. Click here to learn how to read the BaR grid. The BaR is updated on Friday, providing weekly updates with the most recent economic data.”
According to the above chart, a recession could be near, at least as of the end of February. The chart for 2/21 looked very similar. This is a purely data driven result devoid of opinion, “insight”, or theory. In my opinion, the best kind!
There are Fed models which currently concur with the econpi.com. The Cleveland Fed has a recession forecasting model that currently predicts a 55.33% chance of a recession that goes up to 59.42% by August.
Questions Raised
This does raise some significant questions.
- Which model is correct?
- What will the Fed do with interest rates?
- What, if anything, can the government do to mitigate a potential slowdown?
The fact is we have no way of knowing which of the models is correct. So, as I said previously, the vote is 2-1 for continued growth. Given this turn of events, will the Fed adjust interest rates? No, I don’t think so. The Fed has been clear that inflation needs to move toward 2% before they feel comfortable lowering rates significantly. But, if the economy does get worse and a recession develops, the Fed has room to lower rates.
For its part, the government can pursue a pro-growth, pro energy production, low regulation, low tax, and business friendly policy agenda. This more than anything is central to quelling inflation and avoiding a potential recession.
An AI Economic Model To The Rescue!
[Spencer]

Spencer Wright is the Executive Vice President of Halbert Wealth Management, Inc. and the author of Forecasts & Trends. He has been with HWM for over 25 years.