
Shutdowns, A Historical Context
The current understanding of U.S. government shutdowns is a recent development, stemming from a revised interpretation of the Antideficiency Act of 1884. Historically, brief funding lapses did not halt government services. However, in 1980 and 1981, Attorney General Benjamin Civiletti’s legal opinions introduced a stricter interpretation, requiring agencies to cease all non-essential operations during funding gaps. The only exceptions are activities critical for “the safety of human life or the protection of property.”
This reinterpretation established the modern shutdown mechanism, where funding gaps necessitate the furloughing of non-essential personnel. Since 1990, every funding gap exceeding a few hours has led to a shutdown, conditioning financial markets to this unique form of fiscal disruption. For the purpose of this analysis, a “major” shutdown is defined as one that involved employee furloughs and lasted over one full business day.
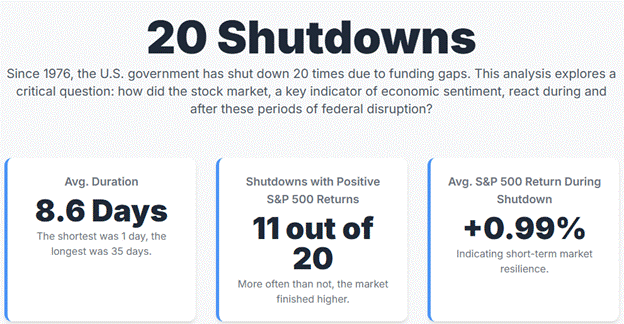
Over the past 50 years there have been 20 government shutdowns, three of the 10 “major” shutdowns are detailed below.
Major Shutdowns and Market Reactions
The three most significant government shutdown episodes are examined here, detailing their economic impact and how U.S. equity markets performed concurrently.
The 1995-1996 Shutdowns: The First Prolonged Test
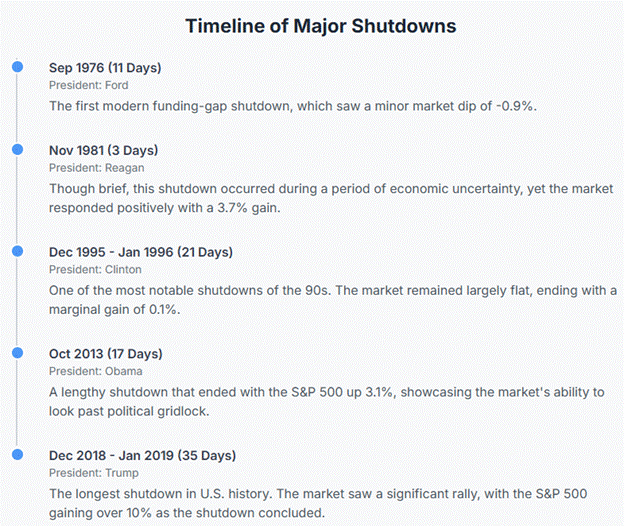
This fiscal impasse involved two separate shutdowns: a 5-day event in November 1995, which furloughed 800,000 workers, and a 21-day event from December 16, 1995, to January 6, 1996, which furloughed 284,000 workers.
- Economic Impact: The Congressional Budget Office (CBO) concluded that the shutdowns had a “depressing effect” on the economy. It estimated that the disruption reduced real GDP growth in the fourth quarter of 1995 by approximately 0.5 percentage points, contributing to a low quarterly growth rate of only 0.3%.
- Market Performance: Despite the clear economic drag, equity markets remained remarkably stable. During the longer 21-day shutdown, the S&P 500 registered a negligible gain of +0.06%. This occurred within a strong bull market and the early stages of the dot-com boom, where investor focus on technology and earnings growth appeared to outweigh concerns over the temporary fiscal disruption.
The 2013 Shutdown: A Post-Financial Crisis
From October 1 to October 17, 2013, the U.S. government experienced a 16-day shutdown, leading to the furlough of approximately 800,000 to 850,000 federal employees.
- Economic Impact: The shutdown inflicted a significant economic toll. Standard & Poor’s estimated a $24 billion loss to the economy and a reduction of at least 0.6 percentage points in annualized Q4 GDP growth. Moody’s Analytics provided a similar estimate, projecting a $20 billion reduction. The U.S. Bureau of Economic Analysis later confirmed a direct 0.3 percentage point reduction from real Q4 GDP growth.
- Market Performance: Despite the negative economic indicators, equity markets demonstrated resilience, recording notable gains. The S&P 500 advanced by 3.1%. This market strength was largely attributed to the highly accommodative monetary policy environment, particularly the Federal Reserve’s third round of quantitative easing (QE3). Investors prioritized the central bank’s support, outweighing the temporary economic drag caused by the shutdown.
The 2018-2019 Shutdown: The Longest in U.S. History
Lasting 35 days from December 22, 2018, to January 25, 2019, this partial shutdown furloughed 380,000 employees and required another 420,000 to work without timely pay.
• Economic Impact: The CBO estimated the shutdown reduced real GDP by $3 billion in Q4 2018 and $8 billion in Q1 2019, for a total impact of $11 billion. Crucially, the CBO concluded that approximately $3 billion of this lost GDP was permanent, representing a 0.02% permanent loss to the nation’s projected GDP for 2019.
• Market Performance: The market’s reaction was perhaps the most compelling evidence of its resilience. Far from declining, the S&P 500 staged a powerful rally, gaining 10.3% during the 35-day shutdown. This performance was driven by a pivotal shift in Federal Reserve policy. The shutdown began near the market’s low point following a sharp correction. In early January, Fed officials signaled a more “dovish” and “patient” approach, pausing a rate-hiking cycle. This change in monetary policy expectations triggered a sharp market rally that completely overshadowed the shutdown’s negative economic effects.
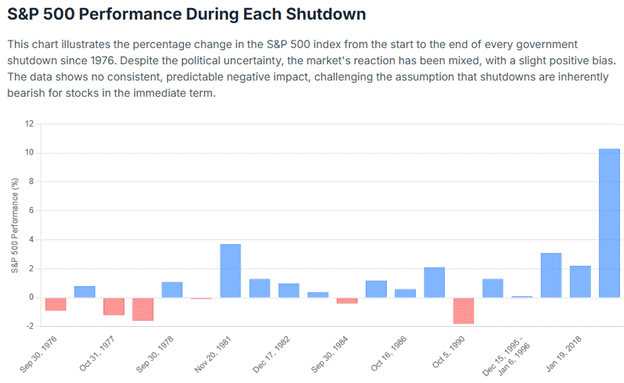
• Average Return: Across 10 major shutdowns, the average return for the S&P 500 was a gain of +0.68%.
• Median Return: The median return was -1.25%, indicating the average is skewed higher by the large gain in 2018-2019.
• Win/Loss Ratio: The S&P 500 posted a positive return in 4 of the 10 shutdowns and a negative return in 6.
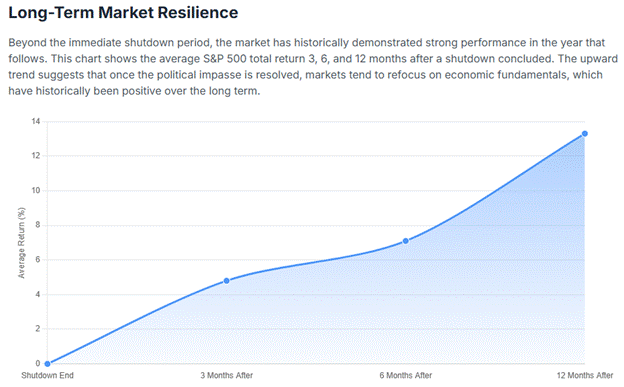
• Post-Shutdown Performance: Analysis shows that the market generally continues its pre-existing trend after a shutdown ends. One study found that 12 months after a shutdown, the S&P 500 was higher 86% of the time, with an average return of 12.7%, reflecting the market’s general long-term upward bias rather than a specific reaction to the shutdown’s conclusion.
The Dichotomy Between Economic Cost and Market Reaction
Government shutdowns consistently highlight a notable discrepancy between their economic consequences and the reaction of the equity market. Despite causing real economic damage, major shutdowns have not significantly impacted the S&P 500.
For example:
- 1995-1996: While Q4 GDP growth dropped by 0.5 percentage points, the S&P 500 remained largely unchanged, increasing by a mere 0.1%.
- 2013: The economy suffered a $24 billion loss, yet the S&P 500 rallied by 3.1%.
- 2018-2019: Despite a permanent $3 billion economic loss, the S&P 500 soared by 10.3%.
This divergence stems from a difference in scale and focus. The economic costs, though substantial in absolute terms, represent an insignificant portion of the vast U.S. economy. For instance, the $3 billion loss in 2019 was a mere 0.02% of that year’s GDP. Equity markets, which factor in future corporate earnings, are more responsive to fundamental economic drivers like interest rates and overarching economic trends than to a temporary, fractional hit to GDP.
A less obvious consequence of shutdowns is the disruption of economic data releases, leading to a data blackout. This delay in inflation and employment reports can leave a data-dependent Federal Reserve flying blind, increasing uncertainty about future monetary policy and potentially contributing to short-term market volatility.
The Bottom Line
U.S. equity markets have consistently shown resilience to government shutdowns, as evidenced by historical and quantitative data. Investors view these events as transient political issues rather than significant risks to long-term corporate profitability.
This market resilience is underpinned by several key factors:
- Scale: The economic impact of shutdowns has been insufficient to significantly alter the aggregate earnings trajectory of U.S. corporations.
- Temporality: Markets consistently assume that shutdowns are temporary and that most delayed economic activity will recover once they are resolved.
- Prioritization of Factors: Investors prioritize macroeconomic variables, particularly Federal Reserve monetary policy, as far more significant drivers of equity valuation than the operational status of the federal government.
AI Shuts Down The Government


Spencer Wright is the Executive Vice President of Halbert Wealth Management, Inc. and the author of Forecasts & Trends. He has been with HWM for over 25 years.