
This week, we are diving deep into the Bear Market—a natural, yet unsettling, part of the financial cycle. Despite the alarming headlines, history and research—from behavioral psychology to statistical physics (treating crashes like earthquakes)—show a different picture. We’ll explore what bear markets are, their typical duration, and how we might predict recoveries.
The Bare Necessities: Definitions and Frequency
Market downturns, which some experts refer to as “rest days,” are a necessary part of the financial cycle. It’s helpful to first clarify the terminology:
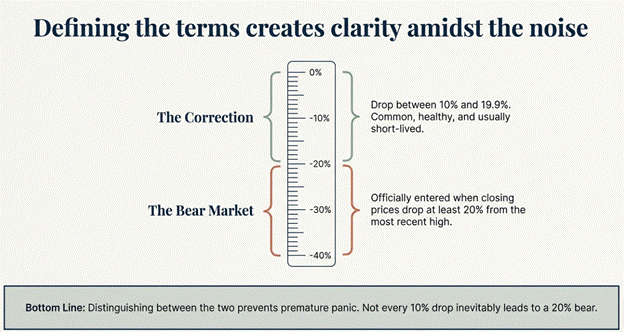
- Correction: A drop in a stock index’s closing price of between 10% and 19.9% from its most recent high.
- Bear Market: Officially occurs when a stock index’s closing price drops at least 20% from its most recent high. This is what is meant by entering bear territory.
Thinking of these drops as a vital reset, much like an elite athlete needs a rest day, is key to understanding their role. They are not uncommon: since 1928, the S&P 500 Index has experienced 27 bear markets, averaging out to one roughly every 3.5 to 4.8 years.
However, a long-term perspective is crucial. In the same period, there were 28 bull markets, leading to significant stock appreciation over time. In fact, stocks have historically been on the rise about 78% of the time over the last 95 years.
The most reassuring factor is the time difference: bear markets are typically much shorter than bull markets.
- Average Bear Market Duration: Approximately 289 days (9.6 months).
- Average Bull Market Duration: Approximately 988 days (2.7 years).
While downturns can be sharp and painful, they are historically temporary interruptions in a longer-term upward trend.
Myth-Busting: Does a Bear Market Always Mean Recession?
The fear that a significant market drop—say, a 20% decline—signals an economic collapse is a common concern among investors. However, historical data shows that while the stock market and the economy are connected, they are not inseparable.
Since 1928, the U.S. has experienced 27 bear markets but only 15 recessions. While bear markets often occur alongside a slowing economy, a decline in the market does not automatically foreshadow a coming recession.
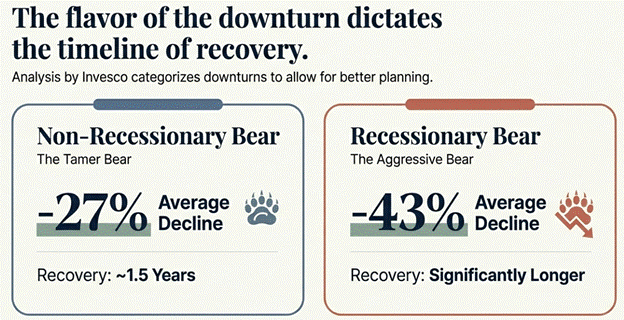
Crucially, the nature of the bear market determines its severity. Invesco’s analysis categorizes these downturns into two types:
- Non-Recessionary Bear Markets: These are typically milder, with an average decline of about 27%.
- Recessionary Bear Markets: These are much more aggressive. When a bear market coincides with a recession, the average drop increases significantly to about 43%.
The time it takes for the market to recover also varies widely. Non-recessionary bears usually regain their previous peak within roughly a year and a half, while recessionary bears require a substantially longer period to recover their losses.
The Psychology of the Fall: Fast Crashes, Slow Recoveries
Why do bear markets feel so much worse than bull markets feel good? It comes down to velocity. Market falls tend to be fast and brutal, while recoveries are often slow and grinding.
This creates a psychological trap. When markets dip, uncertainty spikes, and the temptation to sell to stop the bleeding grows. However, history offers a counterintuitive lesson: the best days often happen during the worst times.
The Cost of Panicking
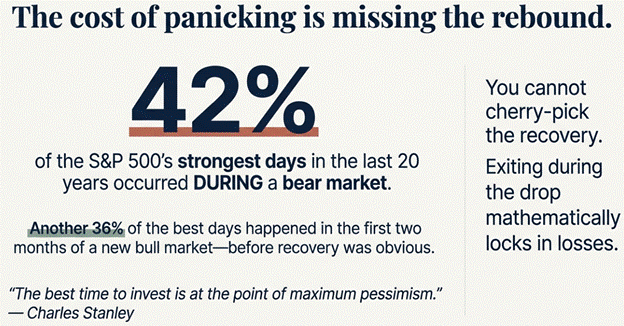
About 42% of the S&P 500’s strongest days in the last 20 years occurred during a bear market. Another 36% of the best days happened in the first two months of a new bull market—before it was even clear that a recovery had begun.
If you try to time the market by jumping out when things look grim, you risk missing these massive rebound days. As Charles Stanley notes, “The best time to invest is at the point of maximum pessimism,” echoing Warren Buffett’s famous advice to be “greedy only when others are fearful”.
Scientific Insights: Earthquakes and “Aftershocks”
For those of us who love data, recent academic research offers a fascinating new lens on market crashes. Researchers are now applying models from geophysics—specifically the Gutenberg-Richter power law, which measures earthquakes—to stock market data.
The “Aftershock” Theory
Research into the 1987 crash, the 2008 Financial Crisis, and the COVID-19 pandemic reveals that significant market downturns resemble “mainshocks” followed by a period of lesser, volatile “aftershocks.”
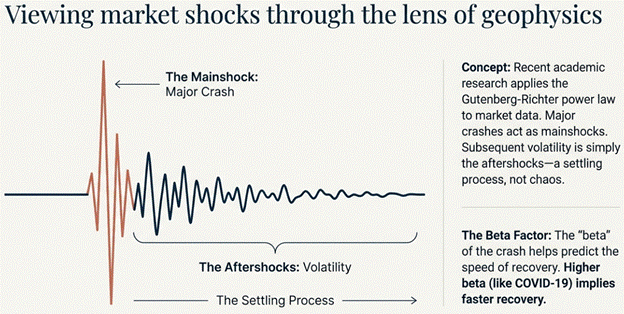
This framework suggests that market volatility is a natural settling process rather than random chaos, with high-magnitude shocks becoming less frequent as stability returns. Notably, the study found the COVID-19 crash had a higher “beta” value than the 2008 crisis, a statistical indicator that correctly predicted its faster market rebound in 2020.
Controlling the Uncontrollable
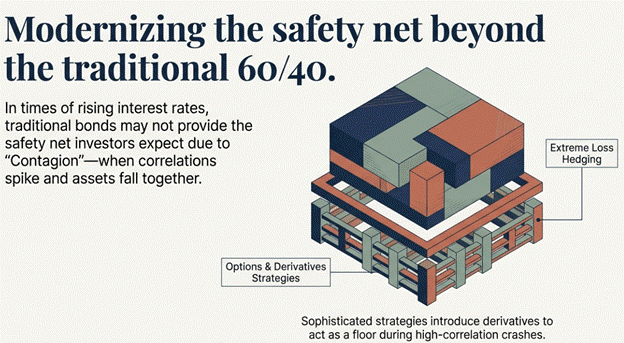
While we cannot stop the earthquake, we can build better foundations. Research on systemic risk suggests that pure stock portfolios are highly susceptible to contagion (when one asset falls, others follow). To combat this, sophisticated strategies may introduce options or derivatives. These tools can act as extreme loss hedging, effectively putting a floor under the portfolio when correlations between stocks spike during a crash.
Alternative Strategies: Beyond the 60/40 Split
When rising interest rates or inflation challenge the traditional safety of bonds, investors often seek alternative assets to manage market volatility.
Alternatives that can offer durability in such environments:
- Private Credit and Floating Rates: Unlike fixed-rate bonds that struggle when rates climb, private credit typically uses floating rates. This mechanism allows the interest payments (coupons) to adjust higher as general interest rates increase, potentially offering better performance during rate-hike cycles.
- Commodities as an Inflation Hedge: Historically, commodities have proven to be a robust hedge against high inflation, often delivering stronger returns than both equities and bonds when inflation exceeds expectations.
- The Behavioral Advantage of Illiquidity: While it seems counterintuitive, assets that are not priced daily and are harder to sell—such as private equity or real estate—can benefit investors behaviorally. Their infrequent pricing reduces the impulse to react to short-term market noise, thereby promoting a necessary long-term investment perspective.
The Takeaway: Stay the Course
The consensus across financial historians, wealth managers, and academic researchers is clear: Bear markets are painful, but they are also temporary and filled with opportunity. The most dangerous thing an investor can do during a bear market is often… something. The urge to “tinker” or sell out of fear can lock in losses. As we’ve seen, missing just a few of the best recovery days can drastically reduce your long-term returns.
AI Ups and Downs

Spencer Wright is the Executive Vice President of Halbert Wealth Management, Inc. and the author of Forecasts & Trends. He has been with HWM for over 25 years.